Connect your WMS. See your warehouse.
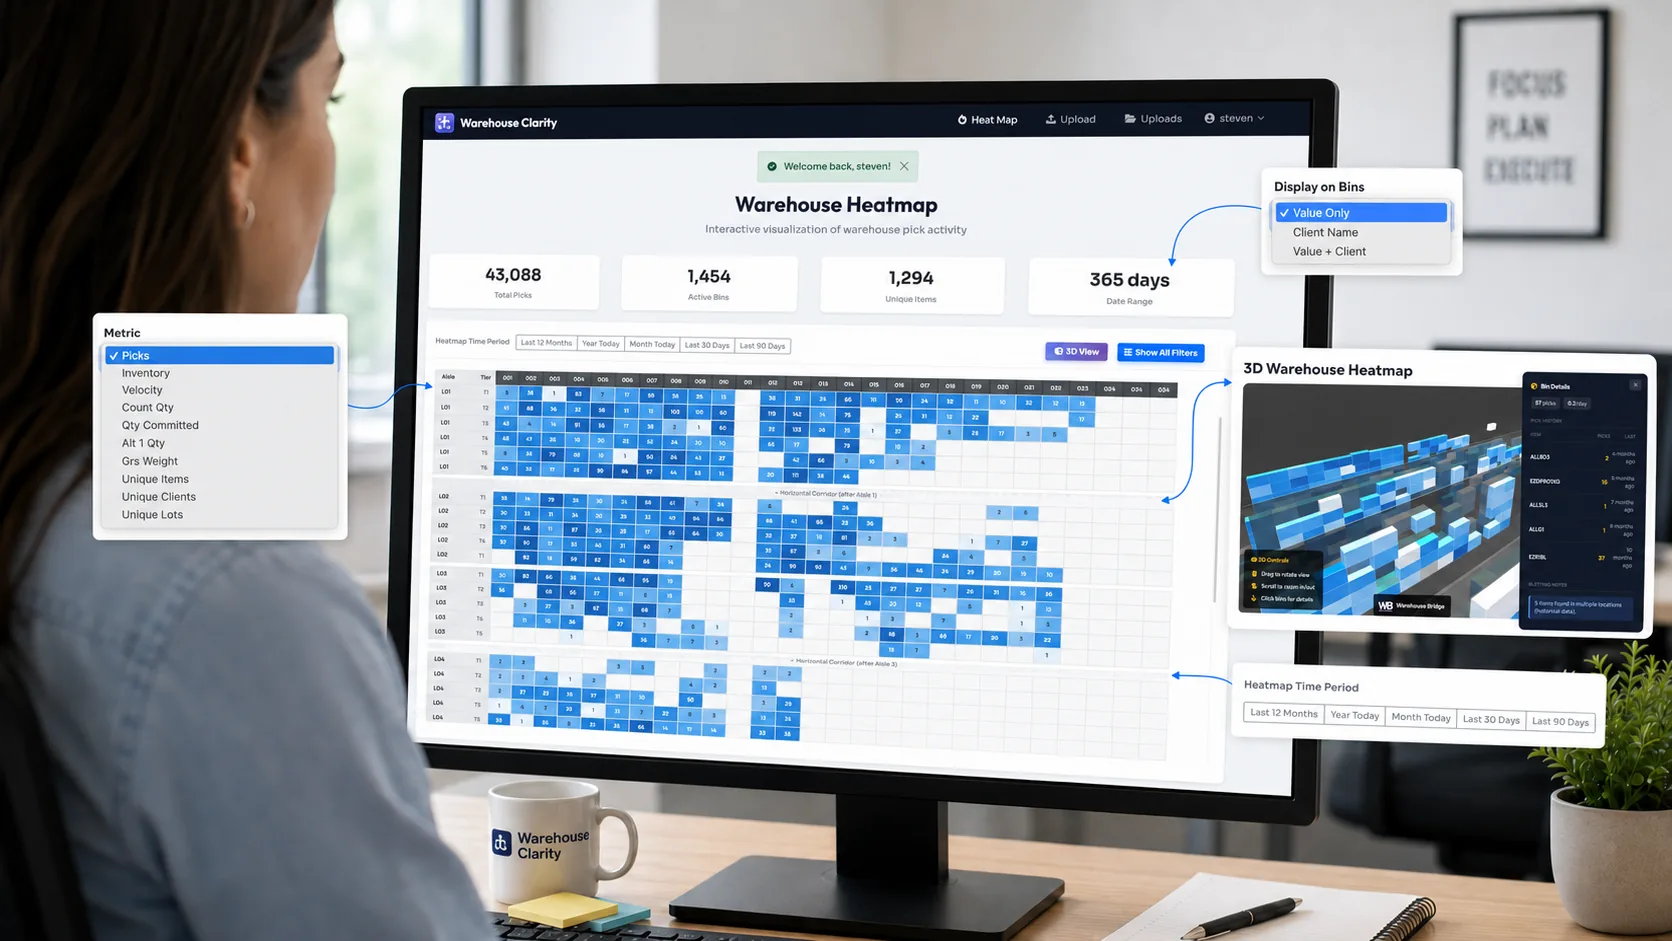
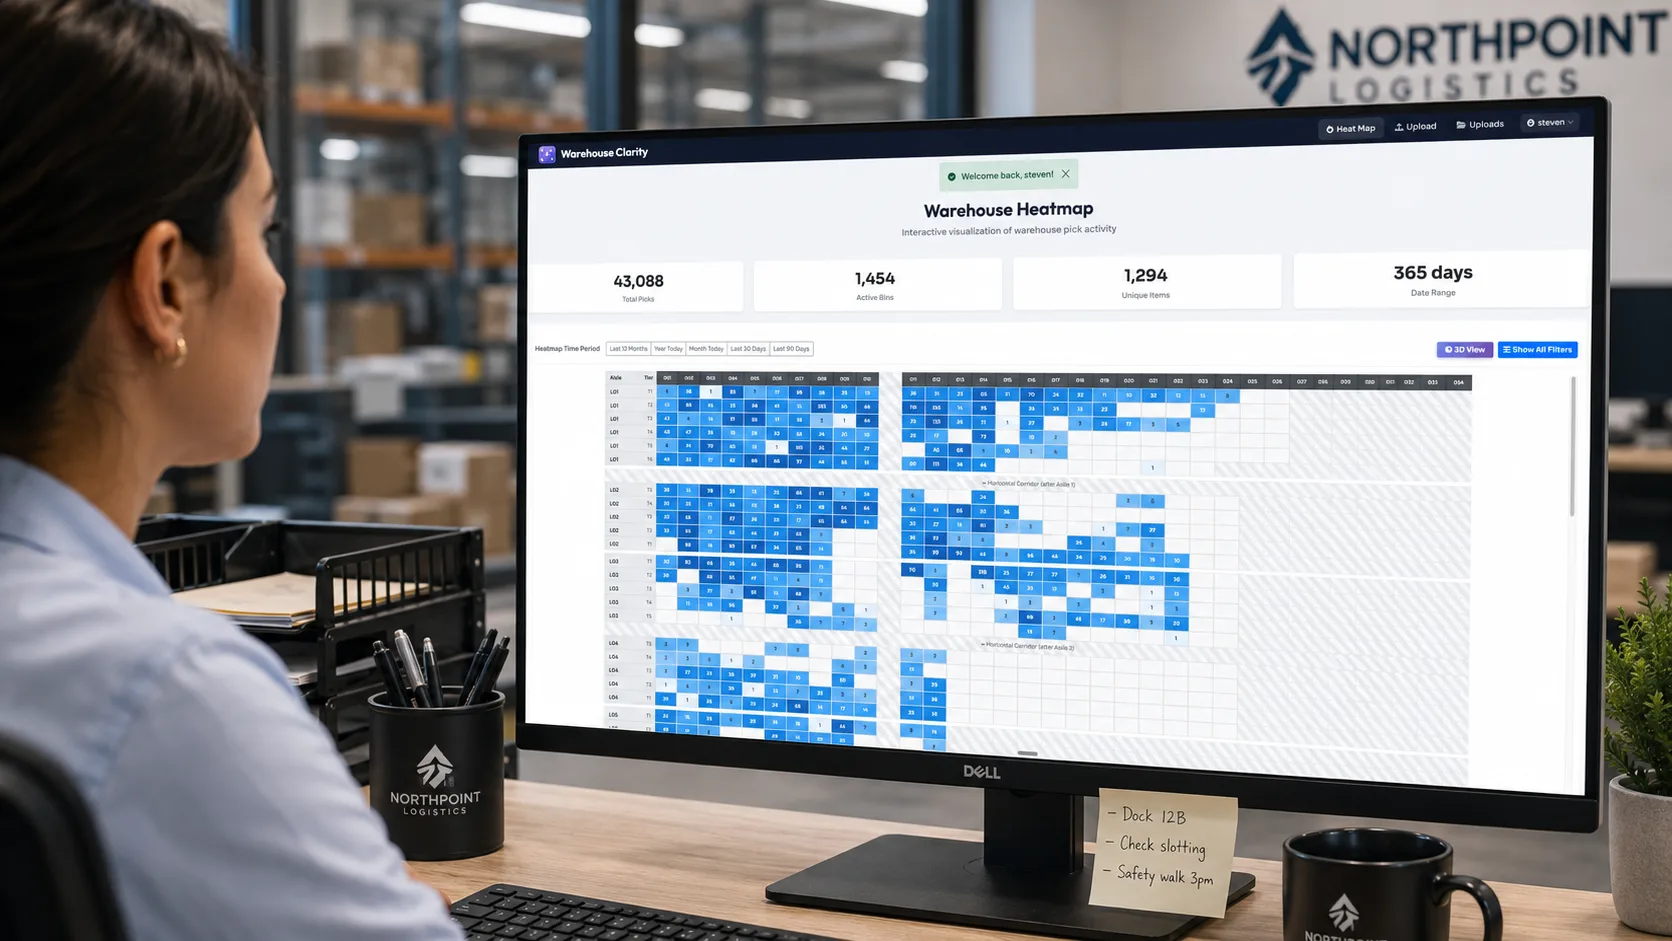
2D facility heat map
Every aisle, section, and tier color-coded by activity. See at a glance which zones are hot, which are cold, and where picks cluster. Toggle between pick count, velocity, unique items, and storage density.
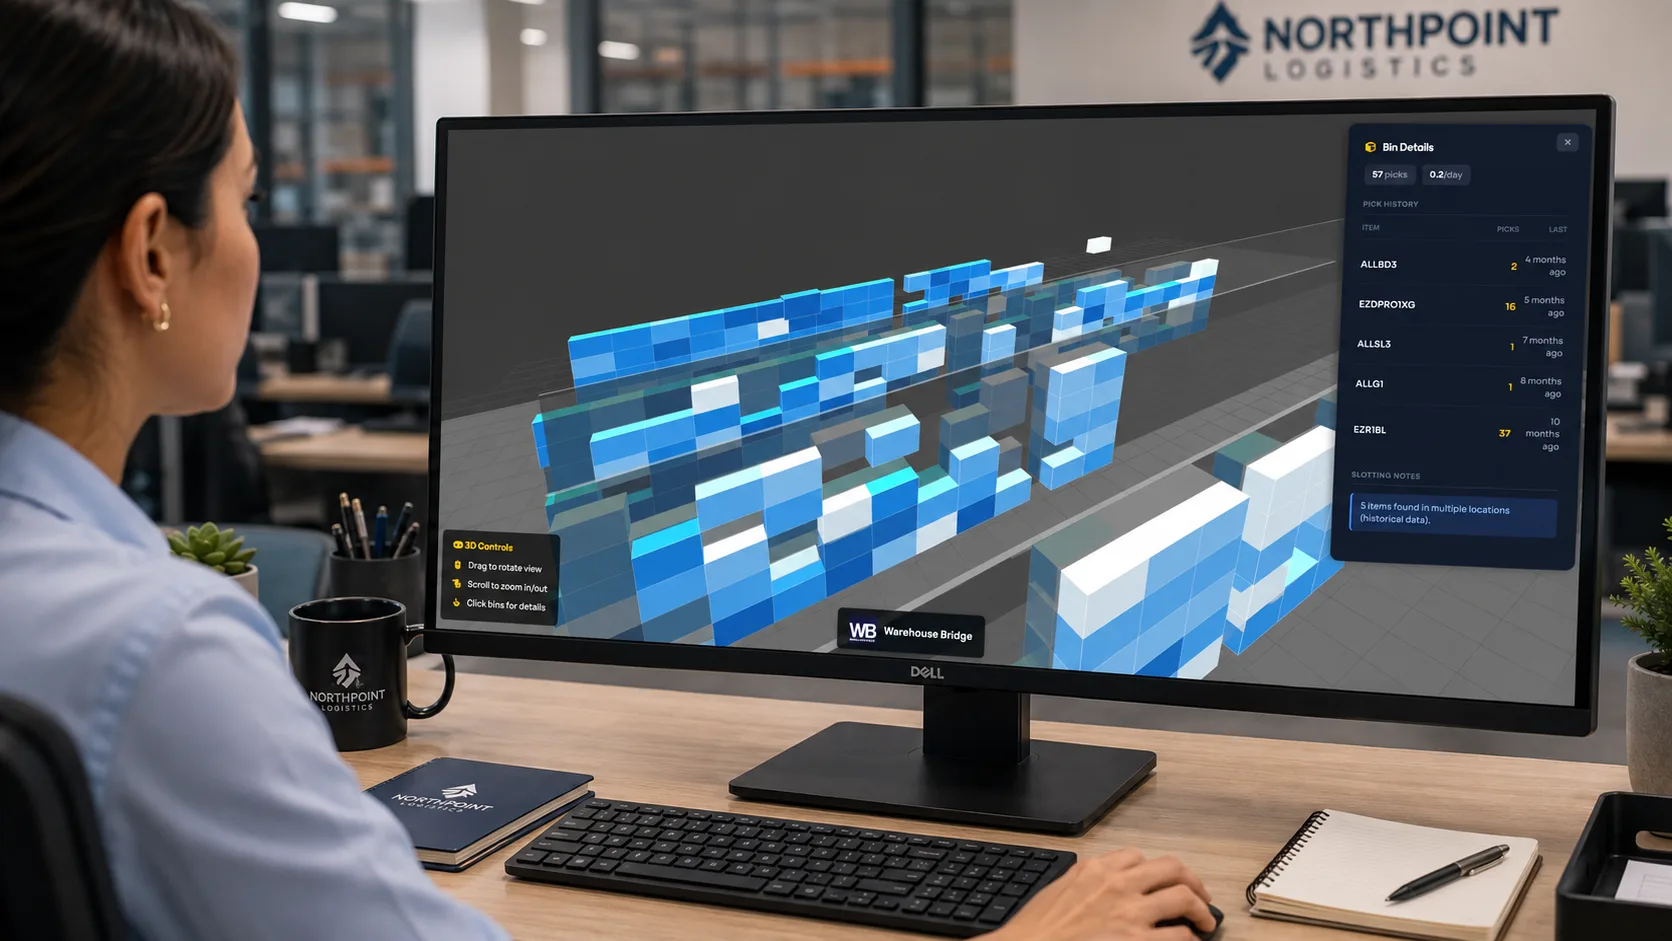
Interactive 3D warehouse visualization
Rotate, zoom, and click through a full 3D model of your warehouse. Click any bin to see its details — pick count, velocity, contents, and history. Powered by three.js, runs in any modern browser.
Direct WMS connection — or upload your data
Camelot users connect directly with zero custom development. Bin locations, pick counts, and inventory data flow in automatically. The heat map updates in real time — no exports, no manual steps.
On a different WMS? You don't have to wait. Start today by uploading CSV or Excel data — works with any WMS that can export bin and pick activity. Join the integration waitlist and we'll prioritize building yours next.
We map your floor plan for you
Send us a sketch, a CAD file, or a photo of your warehouse. We translate it into your interactive heat map layout — aisles, sections, tiers, all configured to match your physical facility.
No DIY layout editor wrestling. No half-day setup project for your ops team. White-glove onboarding is included with every plan.
Drill down from heat map to bin details
Click any cell on the heat map and see exactly what's in that bin — pick count, velocity, unique items, and storage density. Use the warehouse layout editor to configure your grid visually.