Why Your Warehouse Feels Full but Isn't
There's a sentence ops directors say at quarterly reviews that costs more than any other:
"We're going to need more space."
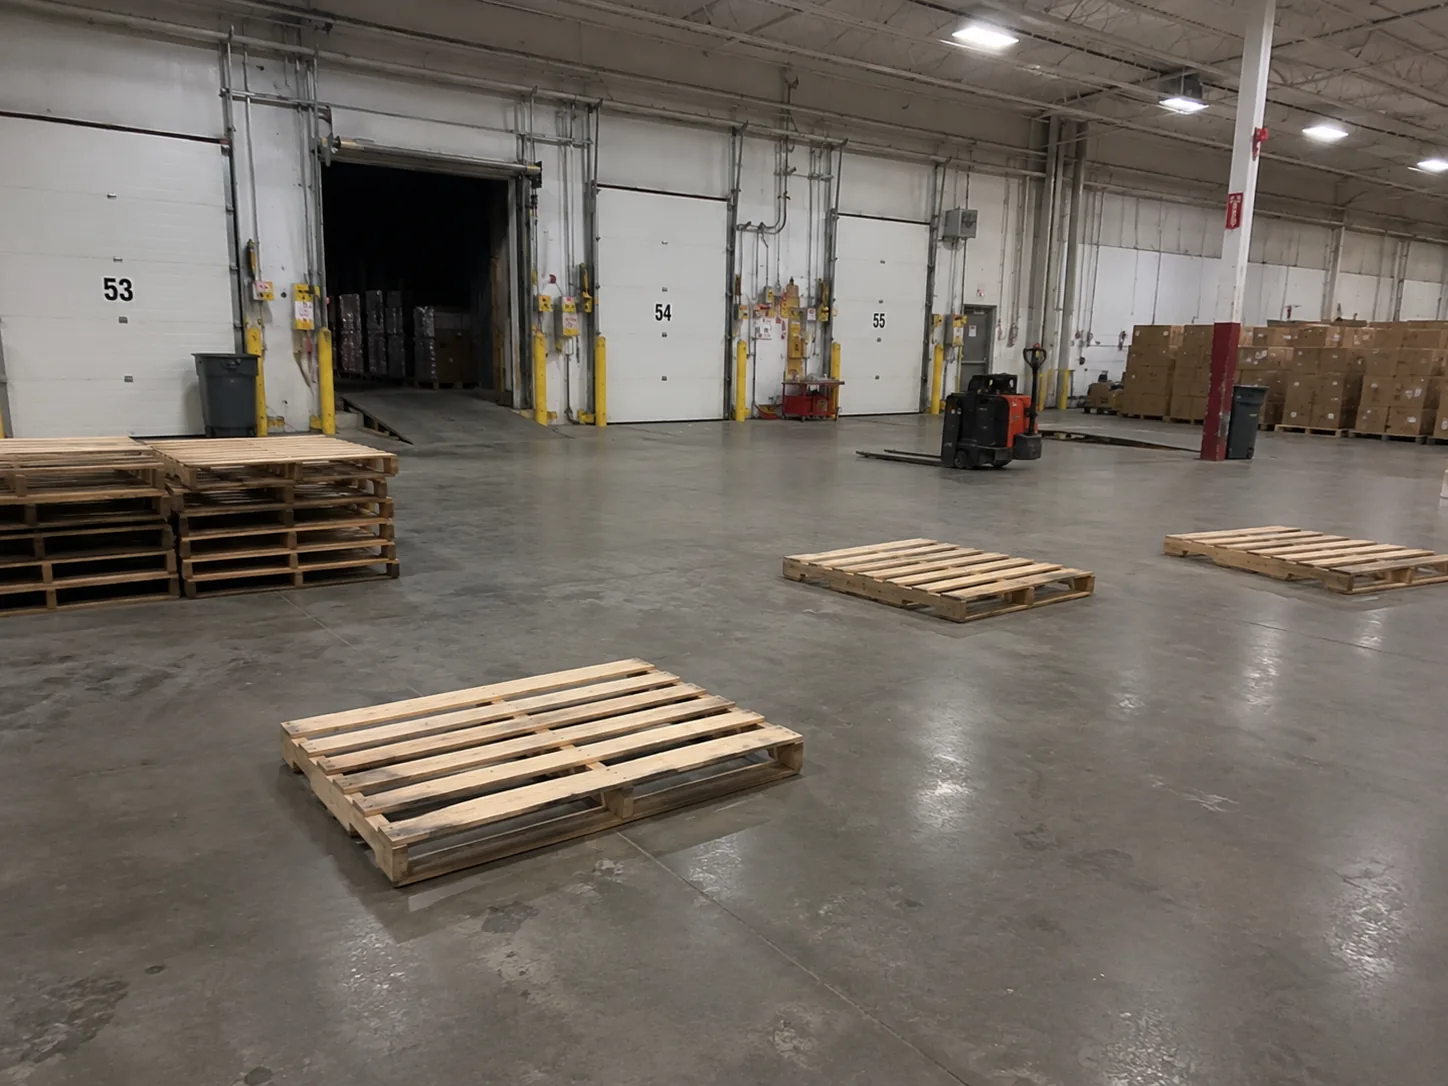
Sometimes that's true. Most of the time it isn't. What's true is that the warehouse feels full — bins look occupied, aisles look congested, putaway is finding fewer good slots. The instinct is to lease another bay, or to start the conversation with the landlord about more square footage.
What's actually happening is usually one of three things, and none of them require new real estate to fix.
1. Honeycombing
Honeycombing is the gap between "the bin is occupied" and "the bin is full." A pallet location with one carton on it counts as occupied in your WMS. From the slotting perspective, it's wasting 90% of its cube.
In any racked warehouse, this happens constantly:
- A vendor sends 8 cartons when the slot was sized for 12.
- A pick takes the last 11 cartons of a 12-carton slot — leaving 1 carton in a primary location until the next replen.
- A SKU's carton count peaks and tapers, but the slot stays the same size.
The WMS sees a full warehouse. The reality is a warehouse that's 60-70% air.
This is the single most common reason a warehouse "feels full." It's also the one that's invisible in a stock report and obvious in a heat map keyed to storage density.
2. Stagnant SKUs holding prime real estate
The second pattern: bins that haven't been touched in 30, 60, 90+ days, sitting in your premium pick zone.
Slotting goes stale faster than people think. A SKU that was a fast mover in Q2 might be inactive by Q4. If nothing forces a re-slot, the dead SKU keeps its spot. Now your real fast movers are deeper into the warehouse than they should be, and the prime real estate is held by inventory you couldn't sell at 30% off.
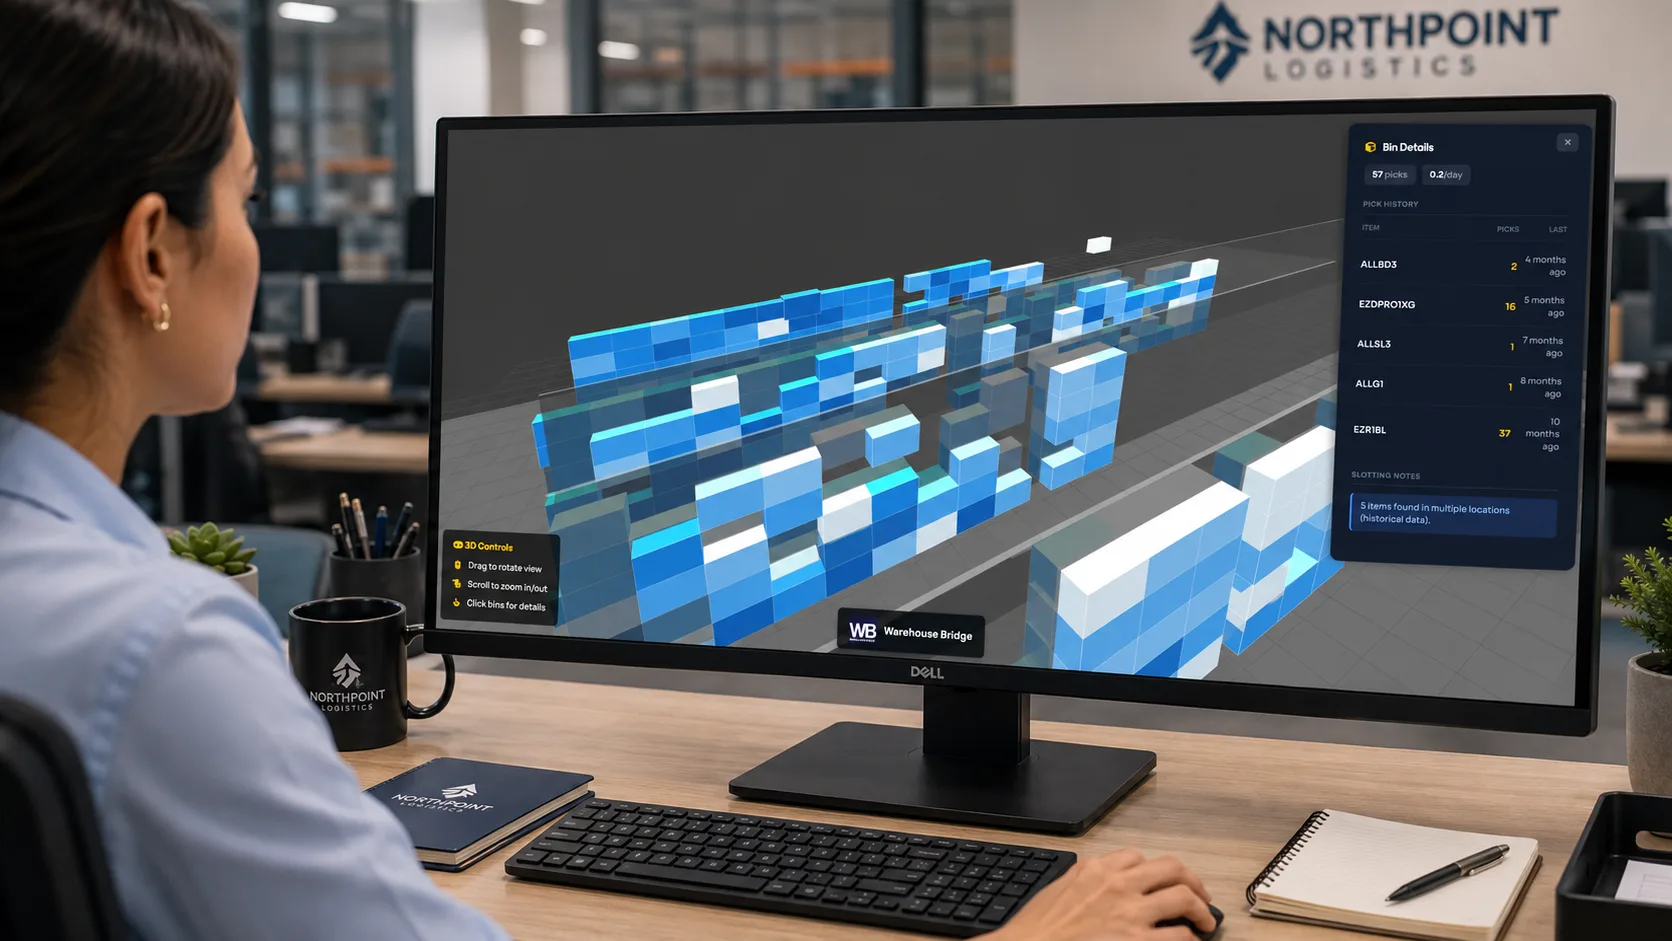
A pick-velocity heat map makes this visible immediately. The bins glow cold. The contents are there. The problem isn't capacity — it's allocation.
The fix isn't more space. It's a re-slot of the cold bins, and probably a hard conversation with whoever's signing off on procurement.
3. Layout drift
The third pattern is structural: the warehouse was laid out for a SKU profile that doesn't exist anymore.
Maybe the operation started with 800 SKUs, mostly bulky. Now it's 3,200 SKUs, mostly small. The aisles are still wide for forklifts that rarely come through. The deep racking is still set up for full pallets that arrive once a quarter. The pick path is still walking through racking that should have been broken into shelving years ago.
This one's harder to see in any single dimension. It usually shows up as a heat map where activity clusters in 15% of the floor and the other 85% is patchwork — some live, some dead, no clear logic.
It's also the one that benefits the most from visualization. A grid view makes the layout drift legible to people who don't walk the floor every day — CFOs, clients (in a 3PL context), executives signing off on capital decisions.
Why your WMS report won't catch this
WMSes are operational systems. They're optimized for "where's the next pick?" not "what is this whole facility doing?"
A typical WMS utilization report tells you something like:
87% of bin locations occupied. 13% available for putaway.
That number is true and almost useless for the question you're actually trying to answer. Bin occupancy is a layout statistic, not a utilization statistic. A warehouse can be 90% bin-occupied and 50% cube-utilized. The utilization number you actually want — how much of the cube I'm paying for is doing work for me — isn't in the standard report.
This is the reason we built Warehouse Heatmap on top of the WMS data instead of trying to replace it. The data's already there. What's missing is the dimension change: from "is this bin occupied" to "is this bin earning."
The 30-minute exercise that often saves a year of rent
If you suspect your warehouse is suffering from any of these patterns, here's the cheapest possible diagnostic:
- Pull a report from your WMS of every bin location.
- Sort by last activity date.
- Count the bins that haven't been picked from in 90+ days.
- Compute that as a percentage of total bins.
Most operations doing this exercise for the first time are surprised. 15-25% of bins inactive for 90+ days is common. 30% isn't unusual.
Now ask the second question: of the bins in your golden zone — the prime pick locations — what percentage are inactive?
If the second number is meaningfully greater than zero, you don't have a space problem. You have a slotting problem. And no amount of new square footage will fix it.
The longer fix is the heat map and the re-slot. The shorter fix is the question above the next time someone asks for more space.